Performance Optimisation and Productivity
Access Pattern Bench Evaluation
Description
The following experiment presents an evaluation and comparison of all Access Pattern Bench applications (AoS, SoA, random access, strided access with strides from 1 to 8). Folder scripts/likwid-tests/ contains scripts to automatically tests and evaluate various program settings and problem sizes. Additionally to execution time, it will measure Hardware Performance Counters (HWC) and Metrics using Likwid.
Further information:
- Which Likwid groups are measured and other test specific settings can be configured in file
scripts/likwid-tests/run_likwid.sh - The script will automatically pin / bind the processes to a fixed core.
- In order to have reliable HWC measurements each benchmark is executed once for every Likwid group.
- The results will contain
hwc_...andoutput_...files that contain Likwid measurement results and execution time respectively.
Detailed information on how to run, reproduce and evaluate this experiment can be found in the README file located in the root folder.
Execution Environment
This experiment has been conducted on one compute node of the CLAIX-2018 cluster partition at RWTH Aachen University. Each node is a two-socket system featuring Intel Skylake Platinum 8160 CPUs with 24 cores running at a base frequency of 2.1 GHz. HyperThreading is disabled and Sub-NUMA-Clustering (SNC) is enabled.
As explained above the serial applications runs have been pinned to a single core different than Core 0 using taskset -c to avoid OS jitter.
Evaluation and Results
The following results present execution time and several other metrics for different problem sizes (columns with number of array elements) and benchmarks (rows). For this particular experiment we chose results where arrays are only read and not written.
Overall Performance
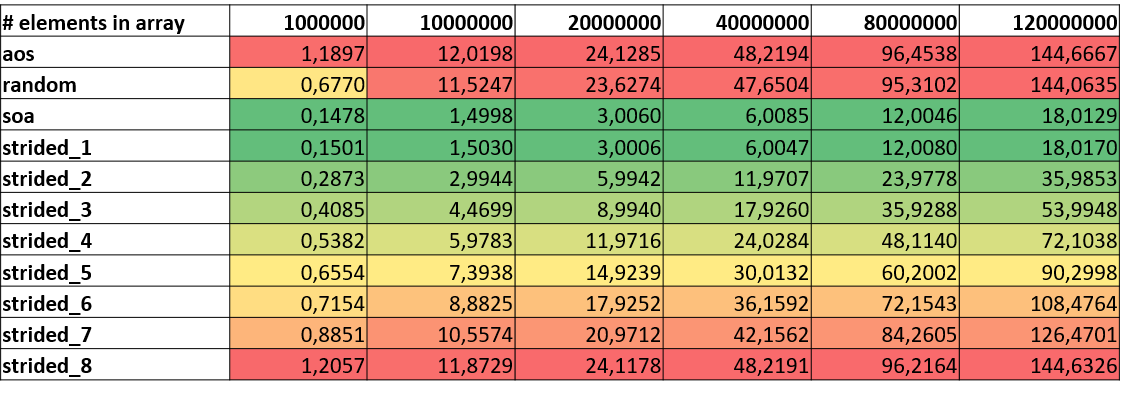
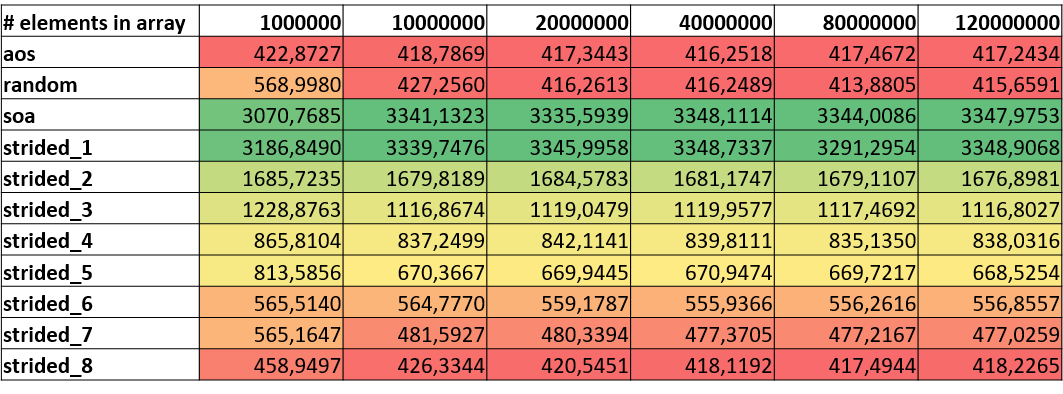
The following table shows execution times of the different kernels for various problem sizes. As expected, it is clearly observable that SoA and linear accesses with stride 1 report the best overall performance. Random and strided accesses with high strides suffer from frequently loading data from main memory.
 |
|---|
| Execution Time (sec) |
Cache Behavior
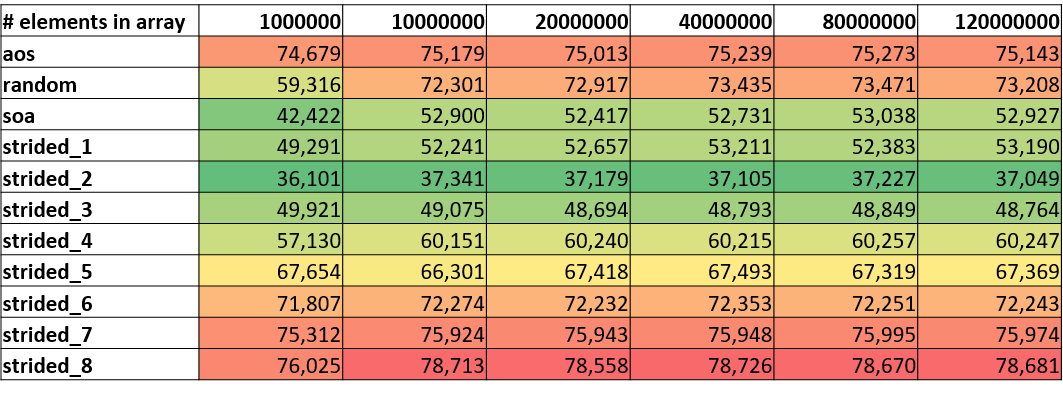
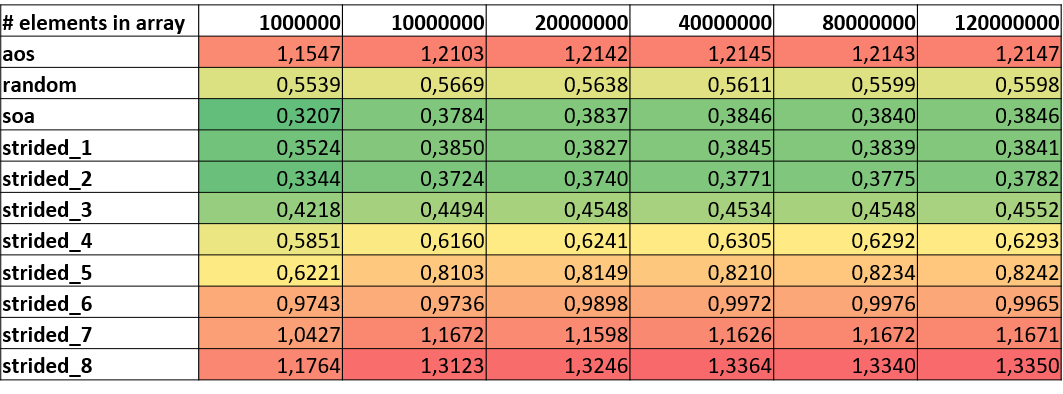
The following tables clearly illustrate the aforementioned assumption that SoA and linear accesses have a significantly better cache behavior than the other more inefficient versions. Most of the stalls in the execution are associated with L1 data misses. However, there is a difference of up to 40% between the best and worst performing version. Surprising is that stride 2 reports slightly better values than stride 1 for L1 data and L2 request rate.
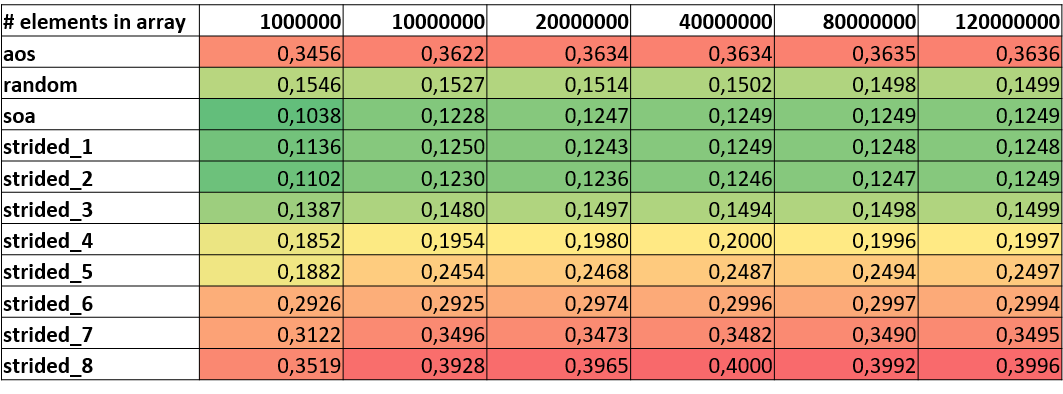
Further, we also see a similar pattern for L2 miss rates. However, here we see that random access reports lower numbers which can be explained by the fact that the benchmark is combining random and indirect accesses. There is another array involved holding the randomly created indices for array accesses which is traversed in a linear fashion. Thus, half of the accesses do not suffer from a strided pattern. Further, in some cases it might be that the next random index is a cache line hit and therefore the overall miss rate is lower than for AoS or stride 8.
 |
|---|
| Stalls caused by L1D misses rate (%) |
 |
|---|
| L2 Request Rate |
 |
|---|
| L2 Miss Rate |
FLOP/s and Vectorization
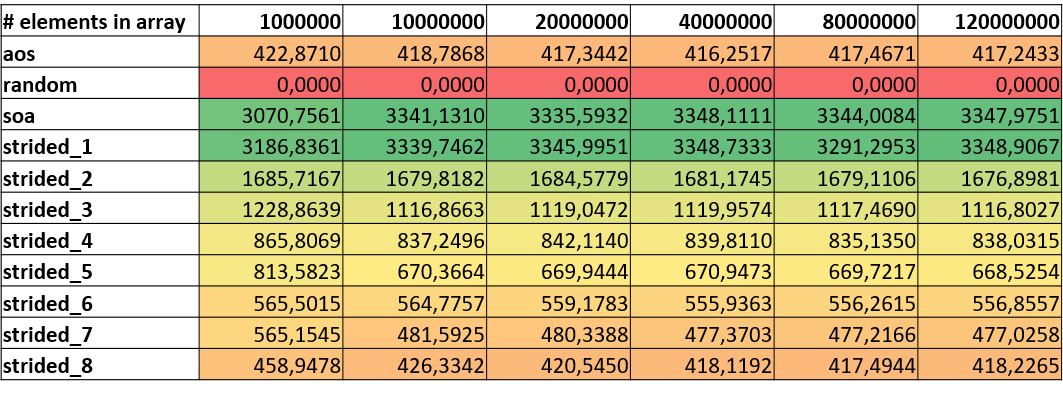
The following tables focus on the resulting values for FLOP/s and vectorization. Although Likwid’s vectorization ratio (not displayed here) is reporting 99%+ vectorization ratios for all benchmark runs, we clearly see that overall FLOP/s differ for the version. A look on packed or AVX DP FLOP/s underlines the assumption that the compiler cannot vectorize code that has indirect or random accesses. Although other strided versions seem to use vector registers they seem to just use a certain portion of the registers resulting in lower numbers for FLOP/s.
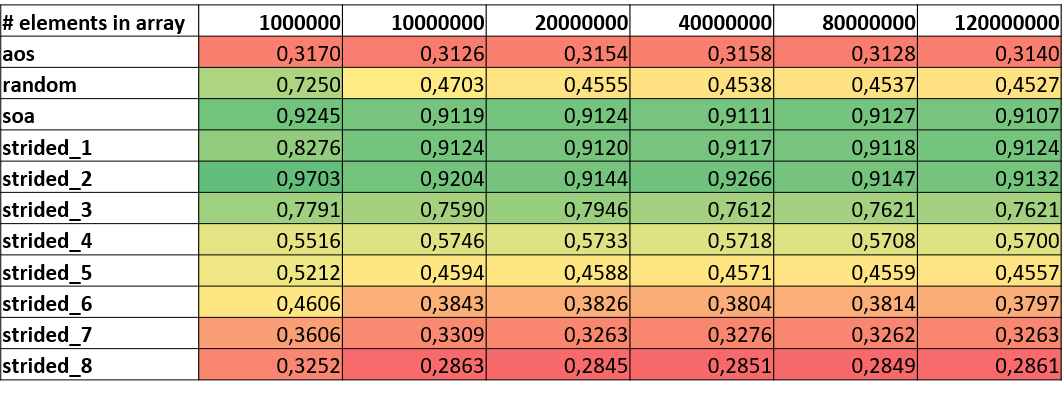
Other metrics that can act as indicators whether an application has issues with strided access patterns are Instructions per Cycle (IPC) or Cycles per Instruction (CPI). IPC values for inefficient access patterns are much lower that for linear accesses or SoA. The fact that random is reporting higher numbers than AoS and some strided patterns has already been explained in the cache behavior section.
 |
|---|
| DP (MFLOP/s) |
 |
|---|
| AVX DP (MFLOP/s) |
 |
|---|
| IPC |