Performance Optimisation and Productivity
Computation-communication trade-off
The data reported below are obtained for the pattern and use strong scaling. The runs were performed on MareNostrum 4.
Speed-up plots
In Figure 1, the speedup plots for the pattern use NUMATOMS = 5,000, NUMATOMS = 50,000 and NUMATOMS = 100,000 particles. In all cases, NUMSTEPS = 20 for the time stepping loop.
| Speed-up plots |
| —— |
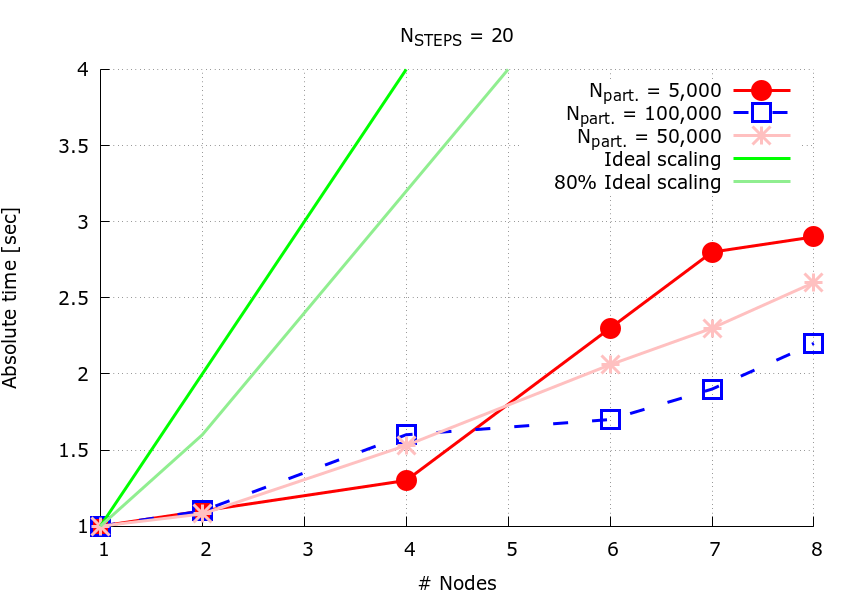
Figure 1: Speedup plots for the pattern for NUMATOMS = 5,000 (red circles), NUMATOMS = 50,000 (pink asterics) and NUMATOMS = 100,000 (blue squares).
On the higher node counts, the higher the number of particles, the slower the application runs. This is because of the increase in the amount of MPI communication, which scales with the number of particles squared. The trend reverses for lower numbers of MPI processes, where the larger the number of particles, the faster the application. This is due to the fact that, for this range of MPI processs counts, the computation is now the bottleneck.
POP Metrics
Figure 2 shows the POP MPI metrics for the NUMATOMS = 1,000 case, computed for 1 and 2 nodes and for three time steps. Due to the low Global Efficiency the computation of the POP metrics was limited to 2 nodes. A full description of the POP MPI metrics can be found here.
The important metric to understand here is the MPI Transfer efficiency. For this benchmark, the communication costs (which scale as the number of particles squared) is the main bottleneck.
POP MPI Metrics (NUMATOMS=1,000) |
|---|
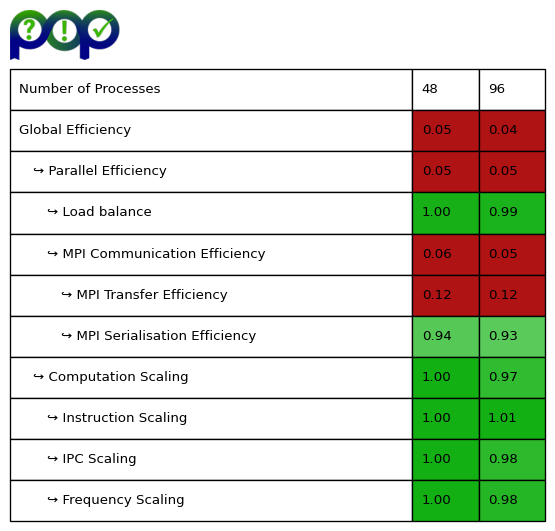 |
Figure 2: POP MPI metrics for the pattern for NUMATOMS = 1,000 and NUMSTEPS=3.