Performance Optimisation and Productivity
SPMxV on RISC-V
SPMxV Elapsed time study
The normalized performance (FLOPS/cycle) for the different platforms is reported below.
 |
|---|
| Normalized FLOPS per cycle for the different versions of the code (scalar/vector) and platform |
The best scalar execution performance is achieved by the Pioneer system. It is followed by the FPGA-SDV system, which has around half its performance. The HiFive and EPAC1.5 fall clearly behind. In the case of the EPAC1.5 we speculate that the high relative memory latency has an important impact towards such low performance. Regarding vector code, the performance shrinks by half compared to the scalar case for the Pioneer, and about one-third in the case of the FPGA-SDV. In the case of the EPAC1.5 at 1 GHz, the performance is similar to the scalar performance. The fact that the NNZ (Number of Non-Zero elements) is only 15, far below the design target of EPAC would reinforce the interest in vectorization approaches that exploit longer vector lengths for this problem. Although the results are bad for the vector run, we need to understand why and get further insight into how the design can be improved beyond moving towards longer vector lengths.
We also studied in terms of elapsed time, the performance when scaling the number of cores in the available multicore platforms. The scaling results are shown below.
 |
|---|
| Scalar code OpenMP speedup with number of cores for the three multicore platforms |
 |
|---|
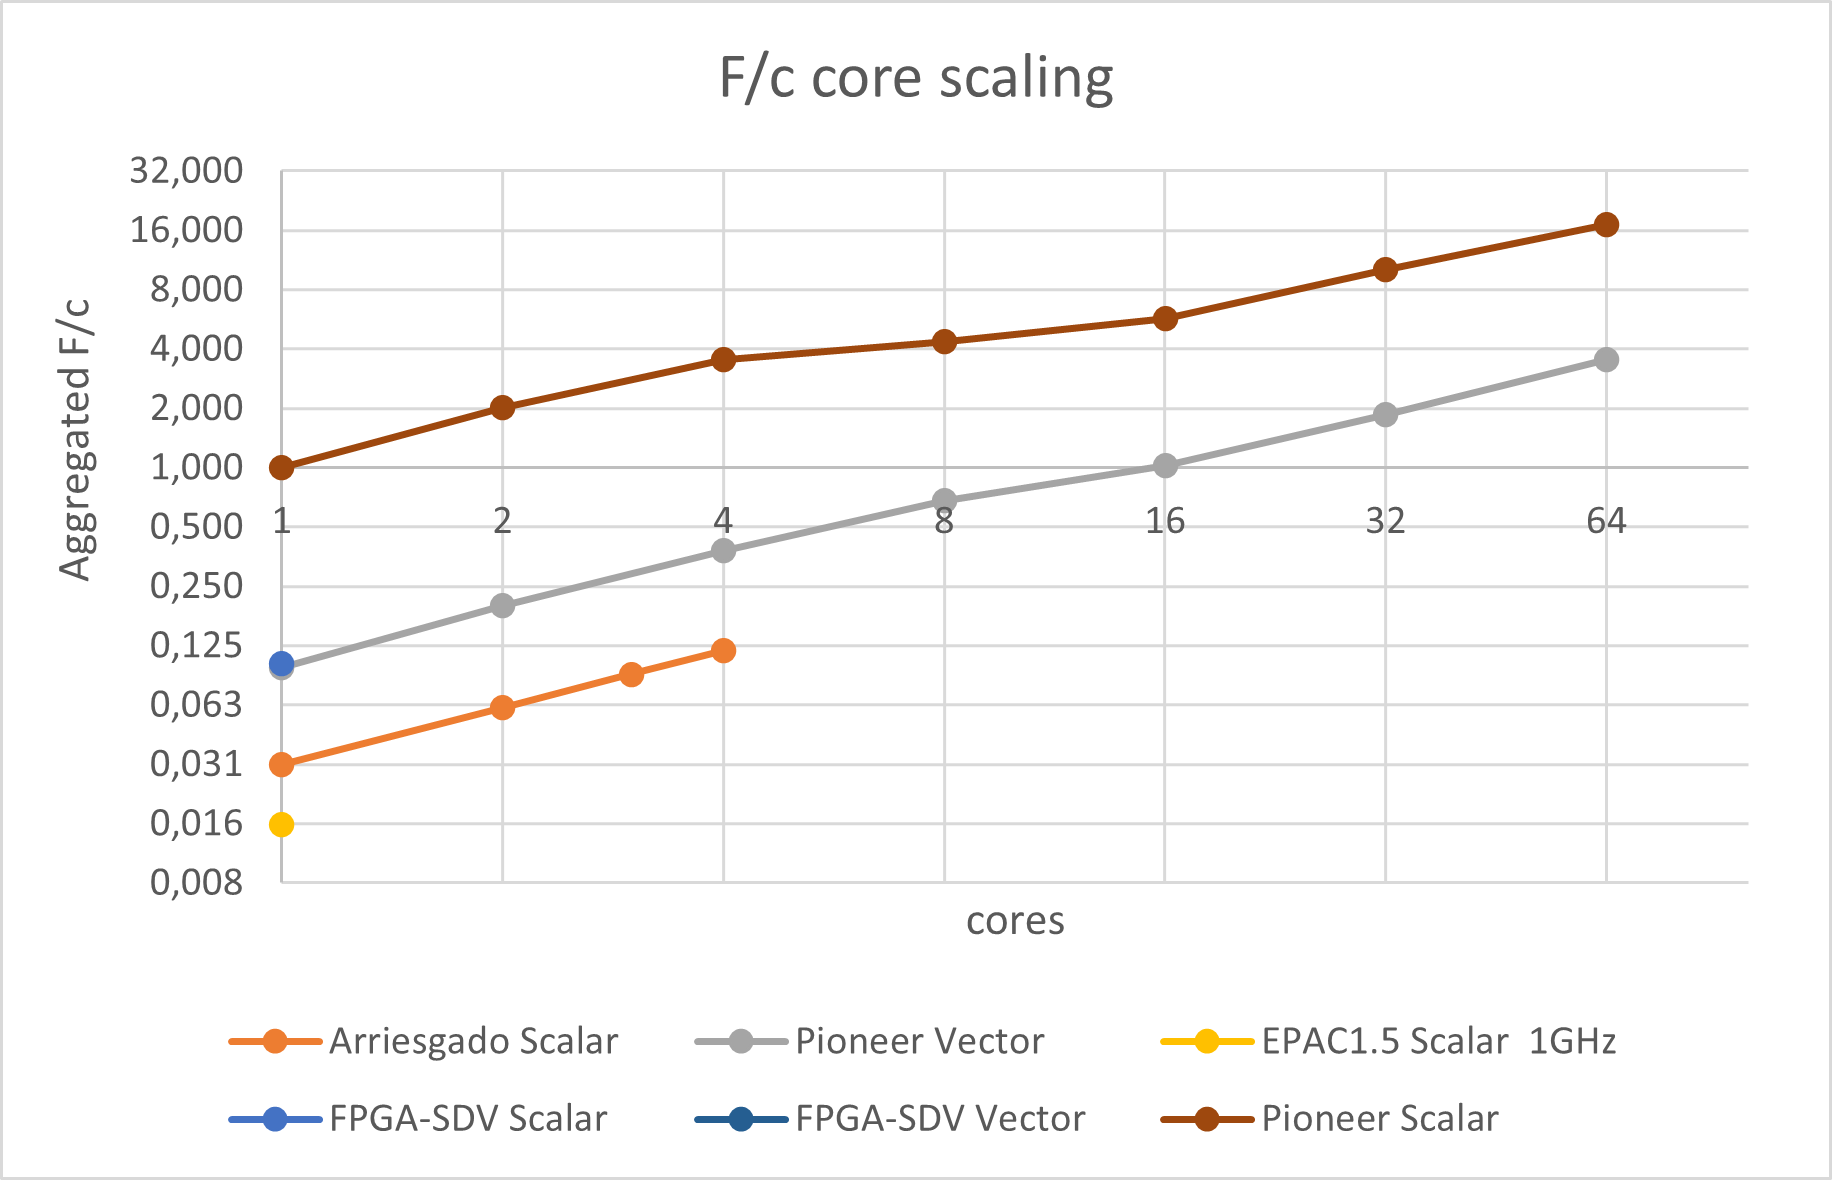
| Aggregated FLOPS per cycle when scaling the number of cores in the different platforms |
The results show a change in the slope at 4 cores in the Pioneer platform and again at 16 cores, which might be linked to the internal micro-architecture. Anyhow, the increase in performance with core count seems to indicate that memory bandwidth saturation, something one typically would suspect for an algorithm with low computational intensity, is not a real problem. A single core not being able to use a relevant fraction of the memory bandwidth neither for a scalar nor vector code is something we consider undesirable and something the EPI architecture should target.
The second scaling figure shows the same numbers in terms of absolute performance in FLOPS/cycle where we can compare the different platforms. In the figure, we can observe that the vector code at the FPGA-SDV with a single core results in about the same normalized performance as the 4 cores SiFive platform. This number should actually be larger, something we will further investigate later in this document.
A final experiment we performed measures the impact of increasing memory latency on both scalar and vector versions. This experiment can only be done in the FPGA-SDV platform. The result is presented below.
 |
|---|
| Impact of additional memory latency on FLOPS per cycle for the scalar and vector version of the code in the FPGA-SDV |
It shows again the better performance of the scalar code under the fast memory subsystem, something that will be investigated later. What we nevertheless want to highlight at this point is the lower sensitivity of the vector EPAC architecture to memory latency, one of the fundamental objectives of the EPI design.
Extrae study
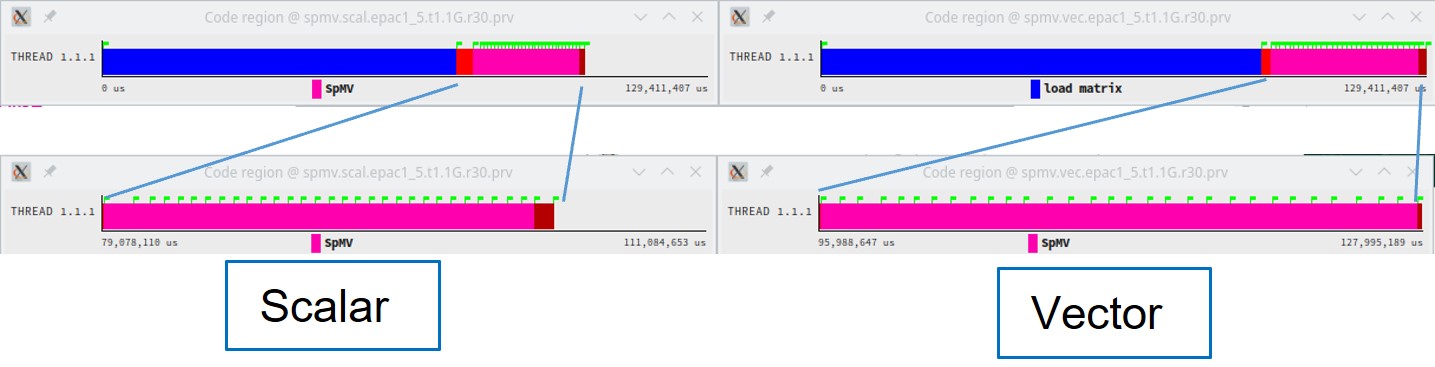
The next level of the evaluation uses Extrae traces to get a deeper insight into the behaviour. We instrumented the main phases of the code including reading the matrix, initializing data structures and each of the invocations of the SpMV kernel. Besides that, we typically activate the sampling mechanism every 10 milliseconds so that we can observe behaviour changes along the run if they appear. The traces can be obtained for the scalar and vector codes on all platforms. In the following figure we compare the timelines of phases for the scalar and vector runs at EPAC1.5 1GHz, showing a somewhat faster scalar code. Quantitative metrics derived from the traces are shown in the table below.
 |
|---|
| Timeline (full run and zoom on the execution of 30 SpMVs) for the scalar and vector version of the code at the same time scale. |
 |
|---|
| Metrics for the Scalar and vector SpMV code computed from the traces in the EPAC1.5 platforms |
We can see the number of instructions executed by the scalar code is about 3.3 larger than by the vector code. Considering we expect every element computation (matrix row by corresponding vector elements) to be vectorized and the known NNZ we would probably have expected a ratio closer to 15. We need to investigate the binary code generated for the vector code by the compiler. Also curious is that only 17 percent of vector instructions are memory-related, while the source code has very low arithmetic intensity. The scalar IPC is about 4.9 better than the vector IPC. Again, to break even we would expect the ratio to be 15. The utilization of the vector unit (VPU) reported by the hardware counter is nevertheless very high (~ 0.93) even with less than 7.4 percent of instructions.
A similar comparison between the scalar runs on EPAC1.5 at 1 GHz and the EPAC FPGA-SDV at 50 MHz is shown below.
 |
|---|
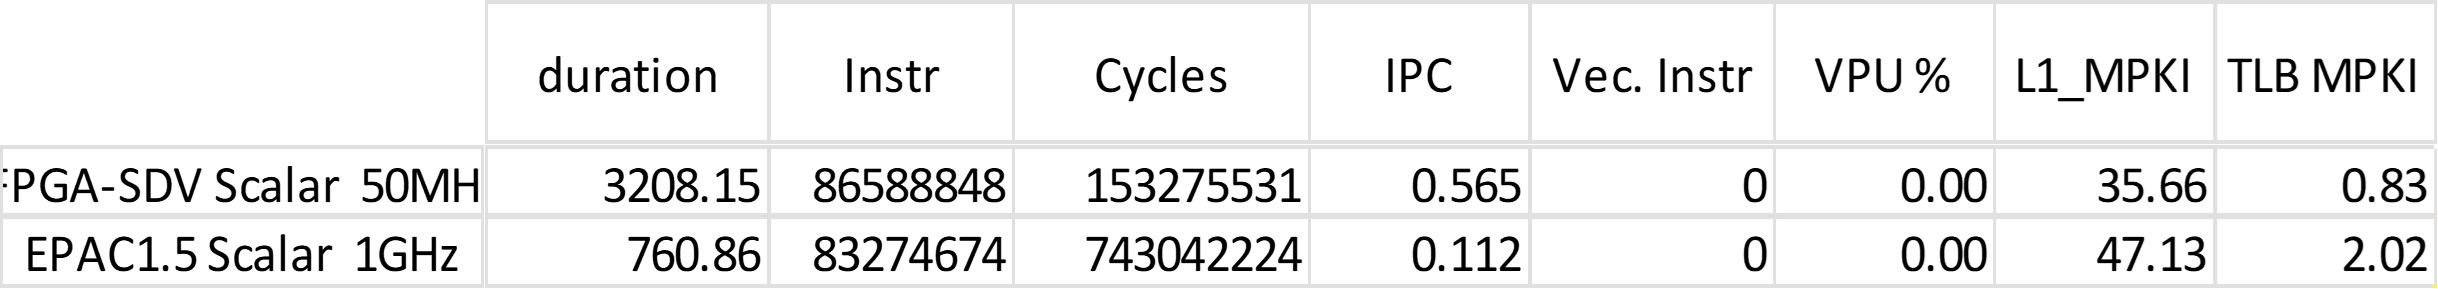
| Metrics for the Scalar SpMV code computed from the traces in the FPGA-SDV and EPAC1.5 platforms |
 |
|---|
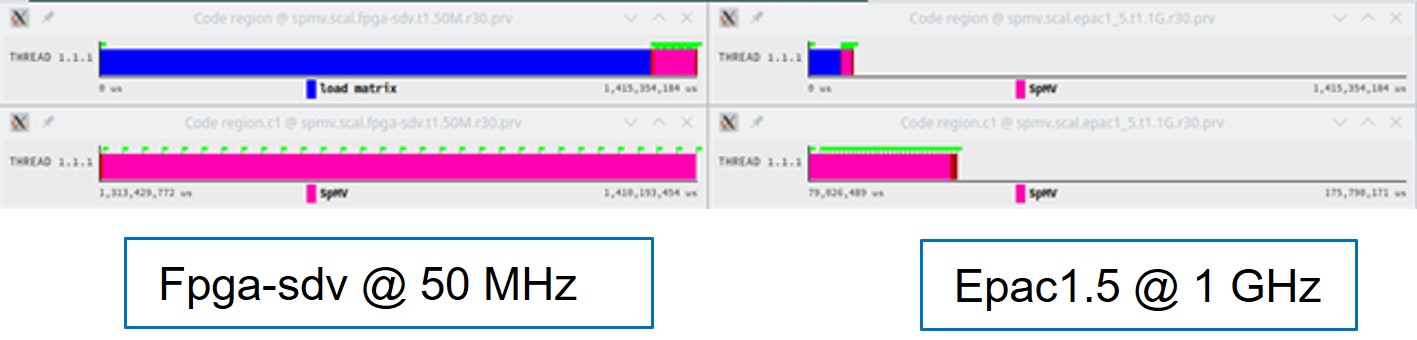
| Timeline for the vector version of the code on the FPGA-SDV and EPAC1.5 platforms at the same time scale |
EPAC1.5 is 4.21x faster than the FPGA-SDV even if the clock is 20x faster. A slightly higher number of instructions in the FPGA-SDV platform may indicate the hardware counter mechanism is also counting the scalar instructions executed by the sampling software within Extrae. This is a potential codesign input for the tools/platform development/maintenance teams, although we do not consider it to be a very important perturbation while producing very useful information.
The IPC is significantly better in the FPGA-SDV case, most probably linked to the fairly large memory latency in the EPAC1.5. The impact of this latency could be further studied using the memory dilation features of the FPGA-SDV. This is done later in the document with the waveform analyses.
We have not really analyzed the cache and TLB MPKIs. That is one of the aspects that we should cover in future work for this study.
A final observation clearly apparent in the traces is the very slow matrix read. This matches the experience in the previous timing runs and suggests the importance of implementing reverse offloading capabilities (further elaboration later in the document).