Performance Optimisation and Productivity
Appropriate process/thread mapping to GPUs
Pattern addressed: Poor GPU data transfer rate due to affinityMost CPUs are organized in multiple NUMA domains. Accessing different parts of the memory from a certain core of such a CPU therefore has different performance. We call this affinity. Since each available GPU on a system is connected to a NUMA domain this effect also is observable in data transfers from and to the GPU. Depending on the location of the data on the host side and the core that is handling the data transfer, both bandwidth and latency can vary significantly. (more...)
Required condition: GPU transfer bandwidth is limited by affinity and not memory channel usage
Using the correct CPU cores to handle data transfers to and from the GPU can have a significant impact on the performance. Especially with large data transfers the bandwidth differs heavily between different NUMA domains and GPUs. This is due to the fact that on most systems GPUs are connected to a NUMA domain and therefore have a NUMA affinity.
Choosing appopriate cores to handle the GPU transfers can be achieved on multiple levels and depends on the programming paradigm used.
- During the job configuration, slurm parameters may be used to set the correct affinities.
- Environment variables may be used to configure runtimes such to map cores and GPUs appropriately.
- Wrapper commands can be used to restrict the execution to certain cores (e.g.
taskset). - Directly in the code calls to libraries such as
nvplcan be used to obtain the necessary information. Then the developer can handle the mapping directly in the code (e.g. with the OpenMPdevice()clause)
Which of these possibilities to ensure a correct mapping between CPU cores and GPUs should be used depends on the hardware resources and the runtimes used. Some clusters provide detailed information about this topic and how to configure jobs on it. If this information is not given by the provider, it can be obtained with vendor tools such as nvidia-smi or rocm-smi. These tools can provide information about the hardware topology and help indentifying GPU affinity. An example output for nvidia-smi topo -m is given below (similar output can be produced with rocm-smi --showtoponuma):
$ nvidia-smi topo -m
      GPU0  GPU1  GPU2  GPU3  NIC0  NIC1  CPU Affinity	NUMA Affinity
GPU0   X    NV6   NV6   NV6   SYS   SYS	  0-11	        0
GPU1  NV6    X 	  NV6   NV6   PIX   SYS	  24-35	        2
GPU2  SYS   SYS	   X    SYS   SYS   SYS	  48-59	        4
GPU3  NV6   NV6	  NV6    X    SYS   PIX	  72-83	        6
NIC0  SYS   PIX	  SYS   SYS    X    SYS
NIC1  SYS   SYS	  SYS   PIX   SYS    X

Legend:

  X    = Self
  SYS  = Connection traversing PCIe as well as the SMP interconnect between NUMA nodes (e.g., QPI/UPI)
  NODE = Connection traversing PCIe as well as the interconnect between PCIe Host Bridges within a NUMA node
  PHB  = Connection traversing PCIe as well as a PCIe Host Bridge (typically the CPU)
  PXB  = Connection traversing multiple PCIe bridges (without traversing the PCIe Host Bridge)
  PIX  = Connection traversing at most a single PCIe bridge
  NV#  = Connection traversing a bonded set of # NVLinks
The output table shows which cores/NUMA domain should handle the transfers to which GPU. This information can then be used to configure the resources accordingly:
- The usage of
slurmparameters allows setting this up correctly. The srun parameter--cpu-bindis used to bind tasks to CPUs. Along with the parameter GPU binding parameters like--gpu-bindit can be ensured that tasks bind to the correct CPU/GPU combination. If one task uses multiple GPUs it is necessary to bind tasks to sockets and multiple GPUs that are connected to that socket. - If one process occupies a node exclusively it just using slurm parameters might not be sufficient. Runtime configuration such as
OMP_PROC_BIND=trueandOMP_PLACESthen ensures threads are not moved. It is then up to the developer to ensure the correct core/device combination is used in the code. In OpenMP this can be done by using thedeviceclause in atargetregion. - Finally the information obtained before execution can also be obtained during runtime. For example the NVML provides functions to obtain CPU cores that are on the same socket as a given device. Using this information during runtime ensures the correct CPU/GPU mapping.
Again, as in the related pattern, we consider the following code pattern:
for(int i = 0; i < n_steps; ++i){
    saxpy(...); // some function including GPU copies and computation
    MPI_Barrier(MPI_COMM_WORLD);
}
When binding the launched MPI ranks to the appropriate NUMA domains that correspond to the used GPUs, we can see that the load balance improves.
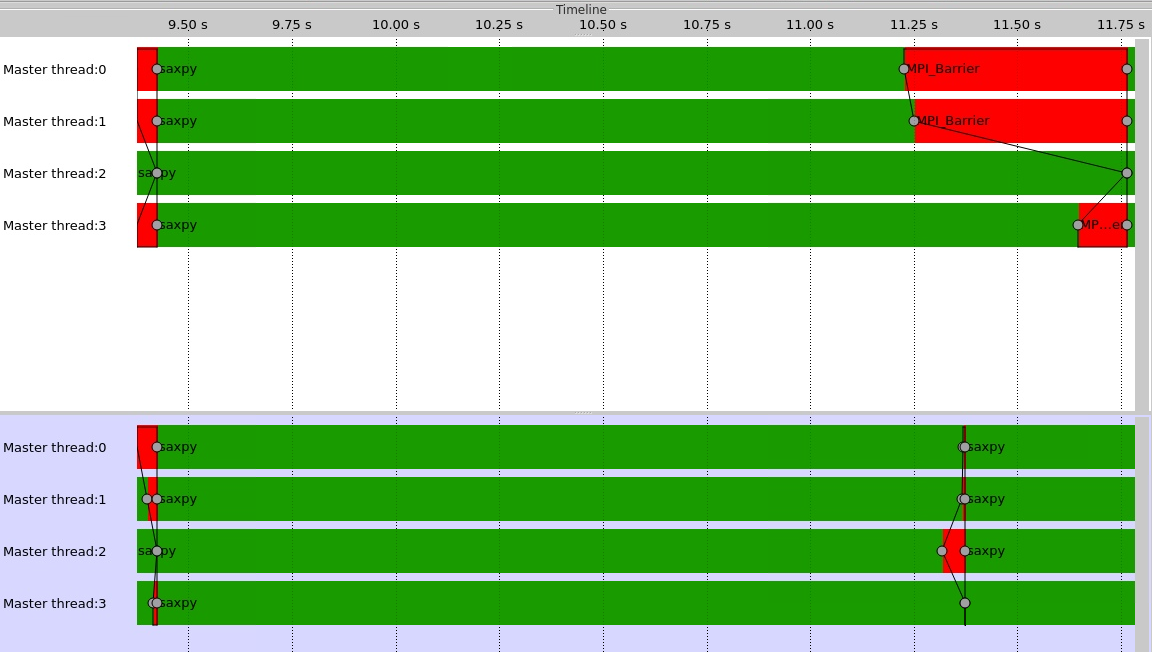
The top trace shows the load balance issue when executing without regards to GPU affinity. The bottom trace shows the improved launch configuration. The MPI Load Balance Efficiency goes up from 86% for the top trace to 97% for the bottom trace. The total runtime also improves by 20% and the next time step starts earlier.
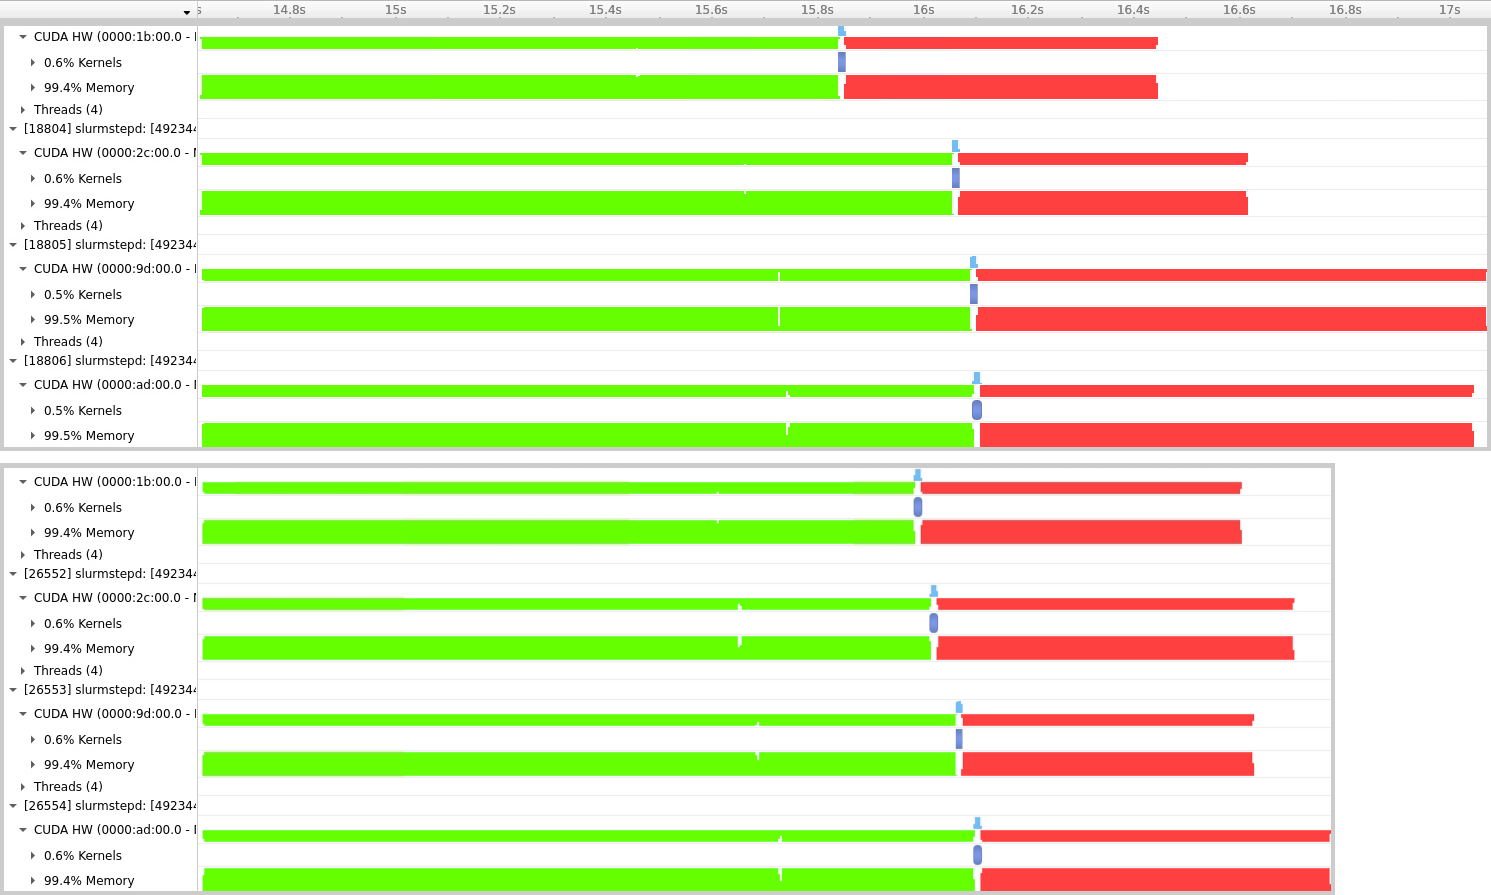
The traces of GPU activity created with Nsight systems show that the runtime of memory operations is the cause of the this runtime difference. The image below shows an example time step without CPU binding (top trace) and with CPU binding (bottom trace). The bottom trace is aligned to match the top time scale of the top trace. Green shows Host-to-Device memory transfers, red shows Device-to-Host transfers, and blue shows GPU computation.
Recommended in program(s): GPU SAXPY with default cpu binding ·
Implemented in program(s): GPU SAXPY with optimal cpu binding ·